仕事で、GPSの軌跡とランドマークを地図上に表示する必要が生したので、色々と調べてみました。いくつかのライブラリが候補に挙がりましたが、WebView2とJavaScriptの組み合わせが軽くて汎用的だったので、その方法をまとめてみました。
単に表示するだけでなく、少しづつ軌跡を描いたり、軌跡を描かずマーカーだけを移動させるアニメーションにも対応し、且つクラス化しています。
すぐに使いたい方はコピペしてご利用ください。
GPS軌跡マッピングの実現方法
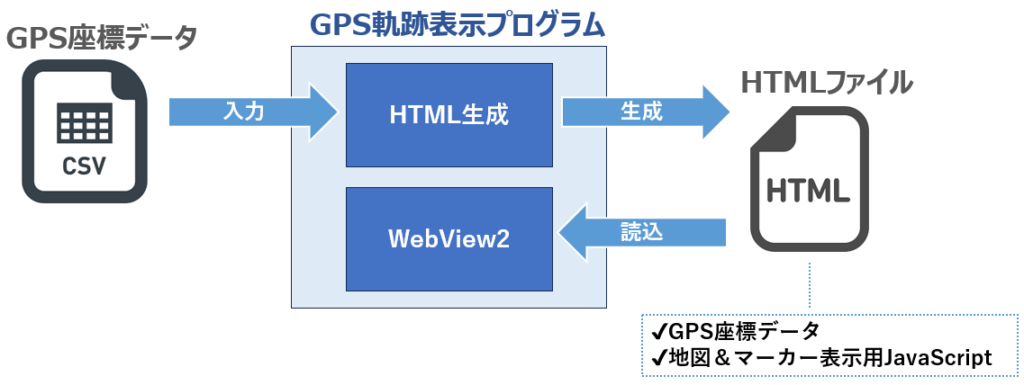
C#を使用して、GPS座標データをブラウザで表示するHTMLを生成し、WebView2コントロールを使用して画面に表示しています。
HTML内には、座標データとそれをプロットするためのJavaScriptコード(Leafletライブラリを使用)が含まれているため、WebView2で表示するだけで、地図上に軌跡をマッピングすることができます。
WebView2とは
WebView2は、Microsoftが提供するWebブラウザーコンポーネントで、WindowsアプリケーションにWebコンテンツを組み込むためのツールです。主に以下の特徴があります。
- Chromiumベース: WebView2は、Chromium(Google Chromeのエンジン)をベースにしているため、最新のWeb技術(HTML5、CSS、JavaScriptなど)をサポートしています。
- WindowsアプリケーションでのWeb表示: C#やC++で開発されたデスクトップアプリケーションに、Webコンテンツを表示するために使用できます。Webページ、HTML、CSS、JavaScriptをアプリ内に組み込むことができ、Webアプリの一部として動作させることが可能です。
- インタラクティブ性: WebView2を使うことで、アプリ内でWebコンテンツを表示し、ユーザーとインタラクションを行うことができます。たとえば、地図を表示するWebページ(Leafletを使ったもの)を、アプリケーション内でインタラクティブに操作できます。

Leafret
Leafletは、オープンソースのJavaScriptライブラリで、インタラクティブな地図をWebページに埋め込むためのツールです。主に以下の特徴を持っています:
- 軽量: Leafletは非常に軽量で、高速に動作するため、モバイル端末や低スペックな環境でも使用可能です。
- 簡単なAPI: 地図を作成するためのAPIがシンプルで、初心者でも扱いやすい。
- 多くの機能: マーカー、ポリライン、ポリゴン、カスタムタイルレイヤーのサポート、地図のズームやパンなど、地図の基本的な操作を簡単に実現できます。
- 拡張性: プラグインを利用することで、機能を拡張できます(例: マーカーのクラスタリング、ジオJSONの読み込みなど)。
地図にGPS軌跡をマッピングする具体例(画面サンプル)
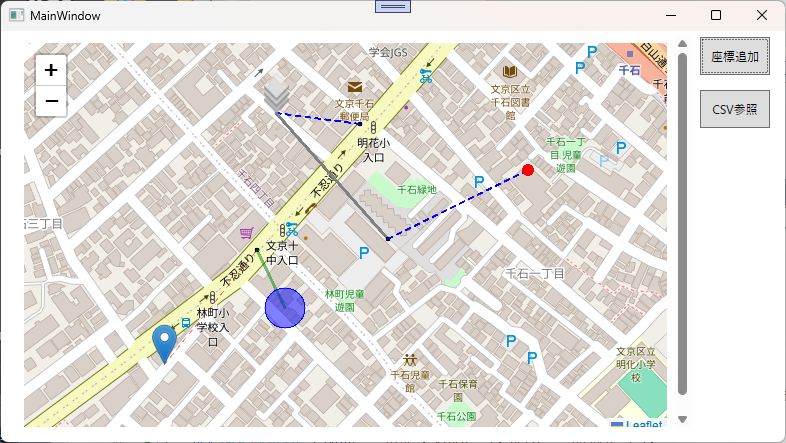
GenerateHtmlFileWithAnimate()の表示

GenerateHtmlFile()のdelayTimeに250を指定
今回紹介するプログラムを使うと、次のことが実現できます。
- GPS座標データを地図上にマッピング(マーカー表示)
- マーカー間の線の種類、色、太さ、透明度、マーカーサイズ、マーカー色、透明度の指定が可能
- 任意の位置にピンの設定が可能
- 少しづつ軌跡を描画するアニメーションが可能
- 軌跡の線を描かず、ピンだけが移動するアニメーションが可能
GPSの軌跡とランドマスターを表示するクラスの使い方
CSVファイルからGPSデータを取得する機能を試したい場合は、下記のデータを gps.csv というファイル名で保存してください。
OCCURRED_DATETIME,LATITUDE,LONGITUDE
2020/11/25 10:08:00,35.1763883,136.7141533
2020/11/25 10:09:00,35.1763833,136.7140683
2020/11/25 10:10:00,35.1763066,136.7137566
2020/11/25 10:11:00,35.1760666,136.7138033
2020/11/25 10:12:00,35.1759416,136.71384
2020/11/25 10:13:00,35.1760216,136.7141983
2020/11/25 10:14:00,35.176345,136.714125
2020/11/25 10:15:00,35.1763166,136.713835
2020/11/25 10:16:00,35.1759616,136.713845
2020/11/25 10:17:00,35.1759383,136.7140883
2020/11/25 10:18:00,35.1760949,136.71418
2020/11/25 10:19:00,35.1760633,136.7142133
2020/11/25 10:38:00,35.17611,136.7138416
2020/11/25 10:39:00,35.1759683,136.7140433
2020/11/25 10:40:00,35.1761116,136.7141466
2020/11/25 10:41:00,35.1763133,136.7141016
2020/11/25 10:50:00,35.1761966,136.7138466
2020/11/25 10:51:00,35.1759616,136.7139483
2020/11/25 10:52:00,35.1763333,136.7140766
2020/11/25 10:53:00,35.1761233,136.713875
2020/11/25 10:54:00,35.1760266,136.71411
2020/11/25 10:55:00,35.1762283,136.7140766
2020/11/25 10:56:00,35.1762633,136.7138816
2020/11/25 10:05:00,35.175455,136.7107349
2020/11/25 10:29:00,35.17657,136.7137466
2020/11/25 10:30:00,35.17657,136.7137466
2020/11/25 14:36:00,35.1773283,136.7126949
使い方
表示したいGPSの経度、緯度をGpsPoints クラスのリストにセットし、 GpsVieualizerクラスの GenerateHtmlFile()メソッドに渡すと、HTMLファイルが生成されます。それをWebView2 の Sourceプロパティに設定するだけです。
// gps データの生成
var points = new List<GpsPoint>
  {
      new GpsPoint { Latitude = 35.7250, Longitude = 139.7400, LineStyle = new GpsLineStyle { Color = "red", Width = 1, Style = "dashed" ,Opacity=0.5}, Text = "ランドマスター1",IconUrl="https://unpkg.com/leaflet/dist/images/marker-icon.png" },
      new GpsPoint { Latitude = 35.7260, Longitude = 139.7410, LineStyle = new GpsLineStyle { Color = "green", Width = 3 , Opacity=0.5}, Timestamp = DateTime.Now.AddSeconds(1), Text = "テキスト" },
      new GpsPoint { Latitude = 35.7255, Longitude = 139.7413, LineStyle = new GpsLineStyle { Color = "green", Width = 0 },  MarkerStyle = new GpsMarkerStyle(){ Color="blue" ,Size=20, Opacity = 0.5, Shape="circle" } },
      new GpsPoint { Latitude = 35.7271, Longitude = 139.7421, LineStyle = new GpsLineStyle { Color = "blue", Width = 2, Style = "dashed" } },
      new GpsPoint { Latitude = 35.7272, Longitude = 139.7412, MarkerStyle = new GpsMarkerStyle { Color = "red", Size = 5, Weight = 2}, Text = "ランドマスター2",IconUrl="https://unpkg.com/leaflet/dist/images/layers.png" },
      new GpsPoint { Latitude = 35.7261, Longitude = 139.7424, LineStyle = new GpsLineStyle { Color = "blue", Width = 2, Style = "dashed" }},
      new GpsPoint { Latitude = 35.7267, Longitude = 139.7439, MarkerStyle = new GpsMarkerStyle { Color = "red", Size = 5, Weight = 2}, Text = "abcde" }
 };

  // HTML生成の呼び出し
 var filePath = @"p:\gps.html";
  new GpsVisualizer().GenerateHtmlFile(filePath , points);

  // WebView2に生成したHTMLを指定
  uxWebView.Source = new Uri($"file:{filePath}");
GenerateHtmlFile() メソッドの第3引数 delayTimeに遅延時間(ミリ秒単位)を指定することで、少しづつ軌跡を表示する(アニメーション化)ことができます。
GenerateHtmlFileWithAnimate() メソッドは、線やマーカーを無視して、ピンだけを移動させるアニメーション表示をするためのものです。
状況に応じて使い分けてください。
クラスの説明
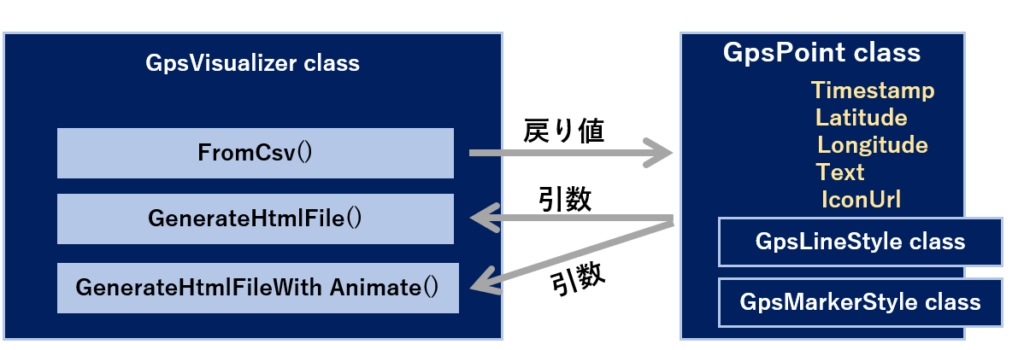
GpsPoint クラス
- Timestamp (DateTime): GPSポイントのタイムスタンプ
- Latitude (double): 緯度
- Longitude (double): 経度
- Text (string): 表示するテキスト
- MarkerStyle (GpsMarkerStyle): GPSマーカーのスタイル設定
- LineStyle (GpsLineStyle): GPSラインのスタイル設定
- IconUrl (string): アイコンのURL
GpsMarkerStyle クラス
- Size (int): マーカーのサイズ
- Shape (string): マーカーの形状(例:丸、四角)
- Color (string): マーカーの色
- Opacity (float): マーカーの透明度
GpsLineStyle クラス
- Style (string): 線のスタイル(例:実線、点線)
- Width (int): 線の太さ
- Color (string): 線の色
- Opacity (float): 線の透明度
GpsVisualizer クラス
- FromCSV (string filePath):
CSVファイルからGPSデータを読み込み、GpsPoint のリストを返します。 - GenerateHtmlFile (string outputPath,List<GpsPoint> points, int delayTime = 0):
points の内容と地図と軌跡マッピング用JavaScriptを合わせたHTMLファイルを生成します。
delayTImeを指定(ミリ秒)すると、その間隔で軌跡をプロットし、省略すると一気にプロットします。 - GenerateHtmlFileWithAnimate (string outputPath,List<GpsPoint> points, int delayTime):
points の内容と地図と軌跡マッピング用JavaScriptを合わせたHTMLファイルを生成しますが、マーカーやラインは無視し、ピンがdelayTimeの時間間隔で移動するアニメーションを表示します。
クラスのソースコード
サンプルプログラムの画面レイアウト(XAMLのソースコード)
あらかじめ、WebView2をNuGetを使ってインストールしておいてください。
<Window
        xmlns="http://schemas.microsoft.com/winfx/2006/xaml/presentation"
        xmlns:x="http://schemas.microsoft.com/winfx/2006/xaml"
        xmlns:d="http://schemas.microsoft.com/expression/blend/2008"
        xmlns:mc="http://schemas.openxmlformats.org/markup-compatibility/2006"
        xmlns:local="clr-namespace:MapSample"
        xmlns:Wpf="clr-namespace:Microsoft.Web.WebView2.Wpf;assembly=Microsoft.Web.WebView2.Wpf" x:Class="MapSample.MainWindow"
        mc:Ignorable="d"
        Title="MainWindow" Height="450" Width="800">
    <Grid>

        <Wpf:WebView2 x:Name="uxWebView" Margin="15,4,95,15"/>
        <Button Content="座標追加" HorizontalAlignment="Right"
                Margin="0,6,15,0" Padding="10" Click="AddGpsPoint_Click" Height="38" VerticalAlignment="Top"/>
    </Grid>
</Window>
サンプルプログラムの画面側のC#ソースコード
using System.Security.Cryptography;
using System.Text;
using System.Text.Json;
using System.Windows;
using System.Windows.Controls;
using System.Windows.Data;
using System.Windows.Documents;
using System.Windows.Input;
using System.Windows.Media;
using System.Windows.Media.Imaging;
using System.Windows.Navigation;
using System.Windows.Shapes;
using System.IO;
using System.Windows.Media.Media3D;

namespace MapSample
{
    /// <summary>
    /// Interaction logic for MainWindow.xaml
    /// </summary>
    public partial class MainWindow : Window
    {
        private string _filePath = "p:/map.html";

        public MainWindow()
        {
            InitializeComponent();
        }
        private void AddGpsPoint_Click(object sender, RoutedEventArgs e)
        {
          var points = new List<GpsPoint>
            {
                new GpsPoint { Latitude = 35.7250, Longitude = 139.7400, LineStyle = new GpsLineStyle { Color = "red", Width = 1, Style = "dashed" ,Opacity=0.5}, Text = "ランドマスター1",IconUrl="https://unpkg.com/leaflet/dist/images/marker-icon.png" },
                new GpsPoint { Latitude = 35.7260, Longitude = 139.7410, LineStyle = new GpsLineStyle { Color = "green", Width = 3 , Opacity=0.5}, Timestamp = DateTime.Now.AddSeconds(1), Text = "テキスト" },
                new GpsPoint { Latitude = 35.7255, Longitude = 139.7413, LineStyle = new GpsLineStyle { Color = "green", Width = 0 },  MarkerStyle = new GpsMarkerStyle(){ Color="blue" ,Size=20, Opacity = 0.5, Shape="circle" } },
                new GpsPoint { Latitude = 35.7271, Longitude = 139.7421, LineStyle = new GpsLineStyle { Color = "blue", Width = 2, Style = "dashed" } },
                new GpsPoint { Latitude = 35.7272, Longitude = 139.7412, MarkerStyle = new GpsMarkerStyle { Color = "red", Size = 5, Weight = 2}, Text = "ランドマスター2",IconUrl="https://unpkg.com/leaflet/dist/images/layers.png" },
                new GpsPoint { Latitude = 35.7261, Longitude = 139.7424, LineStyle = new GpsLineStyle { Color = "blue", Width = 2, Style = "dashed" }},
                new GpsPoint { Latitude = 35.7267, Longitude = 139.7439, MarkerStyle = new GpsMarkerStyle { Color = "red", Size = 5, Weight = 2}, Text = "abcde" }
           };

            // HTML生成の呼び出し
            new GpsVisualizer().GenerateHtmlFile(_filePath, points);
            // WebView2に生成したHTMLを指定
            uxWebView.Source = new Uri($"file:{_filePath}");
        }
        private void LoadGpsPoint_Click(object sender, RoutedEventArgs e)
        {
            // CSVからGPS座標データを読み込む
            var points = GpsVisualizer.FromCsv(@"p:\gps.csv", "OCCURRED_DATETIME", "LATITUDE", "LONGITUDE");
            // アニメーション用メソッドにGpsPointのリストを指定
            new GpsVisualizer().GenerateHtmlFileWithAnimate(_filePath, points,250);
            // WebView2に生成したHTMLを指定
            uxWebView.Source = new Uri($"file:{_filePath}");
        }
    }
}
GPS軌跡表示用クラスのソースコード
namespace が MapSample になっていますので、組み込み先のプロジェクトに合わせて、適宜修正してください。
using System;
using System.Collections.Generic;
using System.Globalization;
using System.IO;
using System.Text;
using System.Text.Json;
using System.Windows.Shapes;
using System.Xml;

namespace MapSample
{
    /// <summary>
    /// GPSの位置情報を表すクラス。
    /// </summary>
    public class GpsPoint
    {
        public DateTime Timestamp { get; set; } // タイムスタンプ
        public double Latitude { get; set; } // 緯度
        public double Longitude { get; set; } // 経度
        public string Text { get; set; } = ""; // テキストに表示する文字
        public GpsMarkerStyle MarkerStyle { get; set; } = new GpsMarkerStyle();
        public GpsLineStyle LineStyle { get; set; } = new GpsLineStyle();
        public string IconUrl { get; set; } = "";
    }

    /// <summary>
    /// GPSマーカーのスタイル設定を表すクラス。
    /// </summary>
    public class GpsMarkerStyle
    {
        public int Size { get; set; } = 2; // マーカーのサイズ
        public int Weight { get; set; } = 1; // マーカーの線の太さ
        public string Shape { get; set; } = "circle"; // マーカーの形状
        public string Color { get; set; } = "black"; // マーカーの色
        public double Opacity { get; set; } = 1; // マーカーの透明度
    }

    /// <summary>
    /// GPSラインのスタイル設定を表すクラス。
    /// </summary>
    public class GpsLineStyle
    {
        public string Style { get; set; } = "solid"; // 線のスタイル
        public int Width { get; set; } = 3; // 線の太さ
        public string Color { get; set; } = "gray"; // 線の色
        public double Opacity { get; set; } = 1; // 線の透明度
    }

    /// <summary>
    /// CSVファイルからGPSポイントを読み込み、リストに変換する。
    /// </summary>
    /// <param name="csvFileName">CSVファイルのパス</param>
    /// <param name="timestampColumn">タイムスタンプの列名</param>
    /// <param name="latitudeColumn">緯度の列名</param>
    /// <param name="longitudeColumn">経度の列名</param>
    /// <returns>GPSポイントのリスト</returns>
    public class GpsVisualizer
    {
        public static List<GpsPoint> FromCsv(string csvFileName, string timestampColumn, string latitudeColumn, string longitudeColumn)
        {
            var points = new List<GpsPoint>();

            using (var reader = new StreamReader(csvFileName))
            {
                // ヘッダーを読み取ってカラムのインデックスを特定
                var header = reader.ReadLine();
                if (header == null)
                {
                    throw new InvalidOperationException("CSVファイルにヘッダーがありません。");
                }

                var columns = header.Split(',');
                var timestampIndex = Array.IndexOf(columns, timestampColumn);
                var longitudeIndex = Array.IndexOf(columns, longitudeColumn);
                var latitudeIndex = Array.IndexOf(columns, latitudeColumn);

                if (timestampIndex == -1 || longitudeIndex == -1 || latitudeIndex == -1)
                {
                    throw new InvalidOperationException("指定されたカラム名がヘッダーに存在しません。");
                }

                // データ行を読み取ってリストに追加
                while (!reader.EndOfStream)
                {
                    var line = reader.ReadLine();
                    if (line == null) continue;

                    var values = line.Split(',');

                    if (values.Length > timestampIndex && values.Length > longitudeIndex && values.Length > latitudeIndex)
                    {
                        try
                        {
                            var timestamp = DateTime.Parse(values[timestampIndex], CultureInfo.InvariantCulture);
                            var longitude = double.Parse(values[longitudeIndex], CultureInfo.InvariantCulture);
                            var latitude = double.Parse(values[latitudeIndex], CultureInfo.InvariantCulture);

                            // 緯度および経度の値が有効な範囲内にあるか確認し、経度や緯度が0でないことも確認
                            if (latitude != 0 && longitude != 0)
                            {
                                points.Add(new GpsPoint
                                {
                                    Timestamp = timestamp,
                                    Longitude = longitude,
                                    Latitude = latitude
                                });
                            }
                            else
                            {
                                Console.WriteLine($"Invalid GPS coordinates: {line}");
                            }
                        }
                        catch (Exception ex)
                        {
                            Console.WriteLine($"Error parsing line: {line}. Exception: {ex.Message}");
                        }
                    }
                }
            }

            return points;
        }

        /// <summary>
        /// GPSポイントのリストをHTMLファイルとして書き出す。
        /// </summary>
        /// <param name="filePath">出力するHTMLファイルのパス</param>
        /// <param name="points">GPSポイントのリスト</param>
        /// <param name="delayTime">マーカーを表示する遅延時間(ミリ秒)。0で一括表示。</param>
        public void GenerateHtmlFile(string filePath, List<GpsPoint> points, int delayTime = 0)
        {
            var html = new StringBuilder();

            html.AppendLine("<!DOCTYPE html>");
            html.AppendLine("<html lang='ja'>");
            html.AppendLine("<head>");
            html.AppendLine("  <meta charset='UTF-8'>");
            html.AppendLine("  <meta name='viewport' content='width=device-width, initial-scale=1.0'>");
            html.AppendLine("  <title>GPS 軌跡</title>");
            html.AppendLine("  <link rel='stylesheet' href='https://unpkg.com/leaflet/dist/leaflet.css' />");
            html.AppendLine("  <script src='https://unpkg.com/leaflet/dist/leaflet.js'></script>");
            html.AppendLine("  <style>#map { width: 100%; height: 100vh; }</style>");
            html.AppendLine("</head>");
            html.AppendLine("<body>");
            html.AppendLine("  <div id='map'></div>");
            html.AppendLine("  <script>");

            html.AppendLine("    var map = L.map('map').setView([35.681236, 139.767125], 13);");
            html.AppendLine("    L.tileLayer('https://{s}.tile.openstreetmap.org/{z}/{x}/{y}.png', { maxZoom: 18 }).addTo(map);");

            var json = JsonSerializer.Serialize(points, new JsonSerializerOptions { PropertyNamingPolicy = JsonNamingPolicy.CamelCase });
            html.AppendLine($"    var points = {json};");
            html.AppendLine($"    var delayTime = {delayTime};");

            // 最初に全てのポイントを基にバウンダリーを設定する
            html.AppendLine("    var bounds = points.map(function(p) { return [p.latitude, p.longitude]; });");

            html.AppendLine("    var index = 0;");
            html.AppendLine("    function addPoint() {");
            html.AppendLine("      if (index < points.length) {");
            html.AppendLine("        var p = points[index];");

            html.AppendLine("        if (p.iconUrl !== '') {");
            html.AppendLine("          var pinIcon = L.icon({");
            html.AppendLine("            iconUrl: p.iconUrl,");
            html.AppendLine("            iconSize: [25, 41],");
            html.AppendLine("            iconAnchor: [12, 41],");
            html.AppendLine("            popupAnchor: [1, -34]");
            html.AppendLine("          });");
            html.AppendLine("          var marker = L.marker([p.latitude, p.longitude], { icon: pinIcon }).addTo(map);");
            html.AppendLine("          if (p.text && p.text !== '') { marker.bindPopup(p.text); }");
            html.AppendLine("        } else {");
            html.AppendLine("          var circleMarker = L.circleMarker([p.latitude, p.longitude], {");
            html.AppendLine("            radius: p.markerStyle.size,");
            html.AppendLine("            weight: p.markerStyle.weight,");
            html.AppendLine("            color: p.markerStyle.color,");
            html.AppendLine("            fillColor: p.markerStyle.color,");
            html.AppendLine("            fillOpacity: p.markerStyle.opacity");
            html.AppendLine("          }).addTo(map);");
            html.AppendLine("          if (p.text && p.text !== '') { circleMarker.bindPopup(p.text); }");
            html.AppendLine("        }");

            html.AppendLine("        if (p.lineStyle && index < points.length - 1) {");
            html.AppendLine("          var lineOptions = {");
            html.AppendLine("            color: p.lineStyle.color,");
            html.AppendLine("            weight: p.lineStyle.width,");
            html.AppendLine("            opacity: p.lineStyle.opacity,");
            html.AppendLine("            dashArray: p.lineStyle.style === 'dashed' ? '5, 5' : (p.lineStyle.style === 'dotted' ? '1, 5' : '')");
            html.AppendLine("          };");
            html.AppendLine("          var line = L.polyline([[p.latitude, p.longitude], [points[index + 1].latitude, points[index + 1].longitude]], lineOptions).addTo(map);");
            html.AppendLine("        }");

            html.AppendLine("        index++;");
            html.AppendLine(delayTime > 0 ? "        setTimeout(addPoint, delayTime);" : "        addPoint();");
            html.AppendLine("      }");
            html.AppendLine("    }");

            html.AppendLine("    addPoint();");
            html.AppendLine("    if (bounds.length > 0) { map.fitBounds(bounds); }");

            html.AppendLine("  </script>");
            html.AppendLine("</body>");
            html.AppendLine("</html>");

            File.WriteAllText(filePath, html.ToString());
        }

        /// <summary>
        /// マーカーがGPS座標を移動するアニメーションHTMLをファイルに書き出す。
        /// </summary>
        /// <param name="filePath">出力するHTMLファイルのパス</param>
        /// <param name="points">GPSポイントのリスト</param>
        /// <param name="delayTime">マーカーが軌跡を1つ移動する際の時間(ミリ秒)</param>
        public void GenerateHtmlFileWithAnimate(string filePath, List<GpsPoint> points, int delayTime)
        {
             var html = new StringBuilder();

             html.AppendLine("<!DOCTYPE html>");
             html.AppendLine("<html lang='ja'>");
             html.AppendLine("<head>");
             html.AppendLine("  <meta charset='UTF-8'>");
             html.AppendLine("  <meta name='viewport' content='width=device-width, initial-scale=1.0'>");
             html.AppendLine("  <title>GPS 軌跡</title>");
             html.AppendLine("  <link rel='stylesheet' href='https://unpkg.com/leaflet/dist/leaflet.css' />");
             html.AppendLine("  <script src='https://unpkg.com/leaflet/dist/leaflet.js'></script>");
             html.AppendLine("  <style>#map { width: 100%; height: 100vh; }</style>");
             html.AppendLine("</head>");
             html.AppendLine("<body>");
             html.AppendLine("  <div id='map'></div>");
             html.AppendLine("  <script>");

             html.AppendLine("    var map = L.map('map');");
             html.AppendLine("    L.tileLayer('https://{s}.tile.openstreetmap.org/{z}/{x}/{y}.png', { maxZoom: 18 }).addTo(map);");

             var json = JsonSerializer.Serialize(points, new JsonSerializerOptions { PropertyNamingPolicy = JsonNamingPolicy.CamelCase });
             html.AppendLine($"    var points = {json};");
             html.AppendLine($"    var delayTime = {delayTime};");

             // 1つのマーカーを地図に追加
             html.AppendLine("    var marker = L.marker([points[0].latitude, points[0].longitude]).addTo(map);");

             html.AppendLine("    var bounds = [];");

             // すべてのポイントの座標をboundsに追加
             html.AppendLine("    points.forEach(function(p) {");
             html.AppendLine("        bounds.push([p.latitude, p.longitude]);");
             html.AppendLine("    });");

             // 座標に合わせて地図の表示範囲を調整
             html.AppendLine("    map.fitBounds(bounds);");

             html.AppendLine("    var index = 1;");
             html.AppendLine("    function moveMarker() {");
             html.AppendLine("      if (index < points.length) {");
             html.AppendLine("        var p = points[index];");

             html.AppendLine("        // マーカーの位置を更新");
             html.AppendLine("        marker.setLatLng([p.latitude, p.longitude]);");

             html.AppendLine("        // 次の位置に移動");
             html.AppendLine("        index++;");

             html.AppendLine(delayTime > 0 ? "        setTimeout(moveMarker, delayTime);" : "        moveMarker();");
             html.AppendLine("      }");
             html.AppendLine("    }");

             html.AppendLine("    moveMarker();");

             html.AppendLine("  </script>");
             html.AppendLine("</body>");
             html.AppendLine("</html>");

             File.WriteAllText(filePath, html.ToString());
        }
    }
}
まとめ
本記事では、WebView2とJavaScript(Leaflet)を活用して、C#アプリケーション内でGPS軌跡を描画する方法を紹介しました。軌跡のアニメーション表示や、マーカーの移動など、視覚的にわかりやすいマッピングを実現し、さらにクラス化することで再利用性も高めました。
この手法を応用すれば、移動体のリアルタイムトラッキングや、ルート比較、特定エリアの通過検知など、さまざまなシナリオで活用できます。
本記事が、皆さんのプログラミングの参考になれば光栄です。


コメント